Using Environmental Justice Screening and Mapping Tool on MTCF
Environmental Justice Screening and Mapping Tool
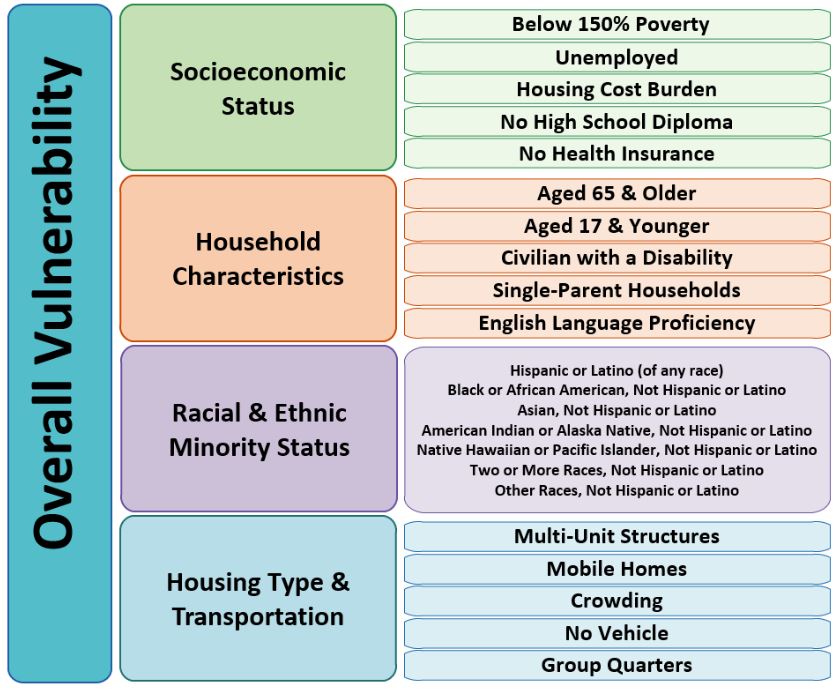
The Environmental Protection Agency (EPA) maintains the Environmental Justice Screening and Mapping Tool (EJScreen) as a means to evaluate inequalities in exposure to various forms of environmental burdens. For EJScreen, the EPA monitors 13 environmental indicators describing exposure to various types of pollution, emissions, or risk factors. These indicators are then combined with a demographic index that reflects the presence of low-income people and people of color in the area. This produces an Environmental Justice Index (EJ Index) where higher values indicate high prevalence of the environmental risk co-occurring with marginalized populations. EJScreen provides each of the EJ Indices as a percentile (nationally and within each state) as an easy way to identify where the environmental justice concerns are most prevalent.
Since MTCF is focused on crash outcomes, users can access two traffic-relevant EJ Indices: diesel particulate matter and proximity to traffic. Both EJ Indices are available for Michigan Census tracts as percentiles, with 0 meaning least environmental justice concern and 100 indicating the most concern, and as a five-level categorical value based on the quintiles of index. The EJ Indices accessible on MTCF are taken from the 2022 EJScreen.
The tract-level EJScreen equity variables are available on MTCF: Diesel Particulate Matter EJI and Traffic Proximity EJI. More information on EJScreen, the datasets used, and interpretation of the indices is available from the EPA here: EPA Dataset Catalog.
Example Use Cases
The primary advantage of tract-level equity measures have over county-level measures is that tract-level measures allow us to examine inequities within much smaller geographic regions. For example, only tract-level measures permit us to compare specific locations within counties and to view the association between equity and crashes within a city.
In this section, we will demonstrate ways the Environmental Justice Indices can be used to answer questions about equity using the MTCF website by working through the following two research questions:
- Check the value of equity metrics for the intersections that had the most bicycle-involved crashes in 2023
- Examine the distribution pedestrian-involved crashes in the City of Kalamazoo across regions based on their equity scores
Note that both of these questions require the use of tract-level variables. The first asks about specific geographic locations and it is likely that several of the intersections are from the same counties (which makes county-level measures inappropriate). The second question aims to evaluate equity within the City of Kalamazoo which requires that the equity measure used demonstrate variability at that level.
For these example use cases we will be using the “Diesel Particulate Matter EJI” variable.
1. Check the value of equity metrics for the intersections that had the most bicycle-involved crashes in 2023
Step 1: Identifying the Intersections
We start by locating the intersections that had the largest number of bicyclist-involved crashes in 2023.
From the MTCF Data Query Tool, click on “Time Frame” and select 2023. With 2023 selected, click on the “View Sorting” option.
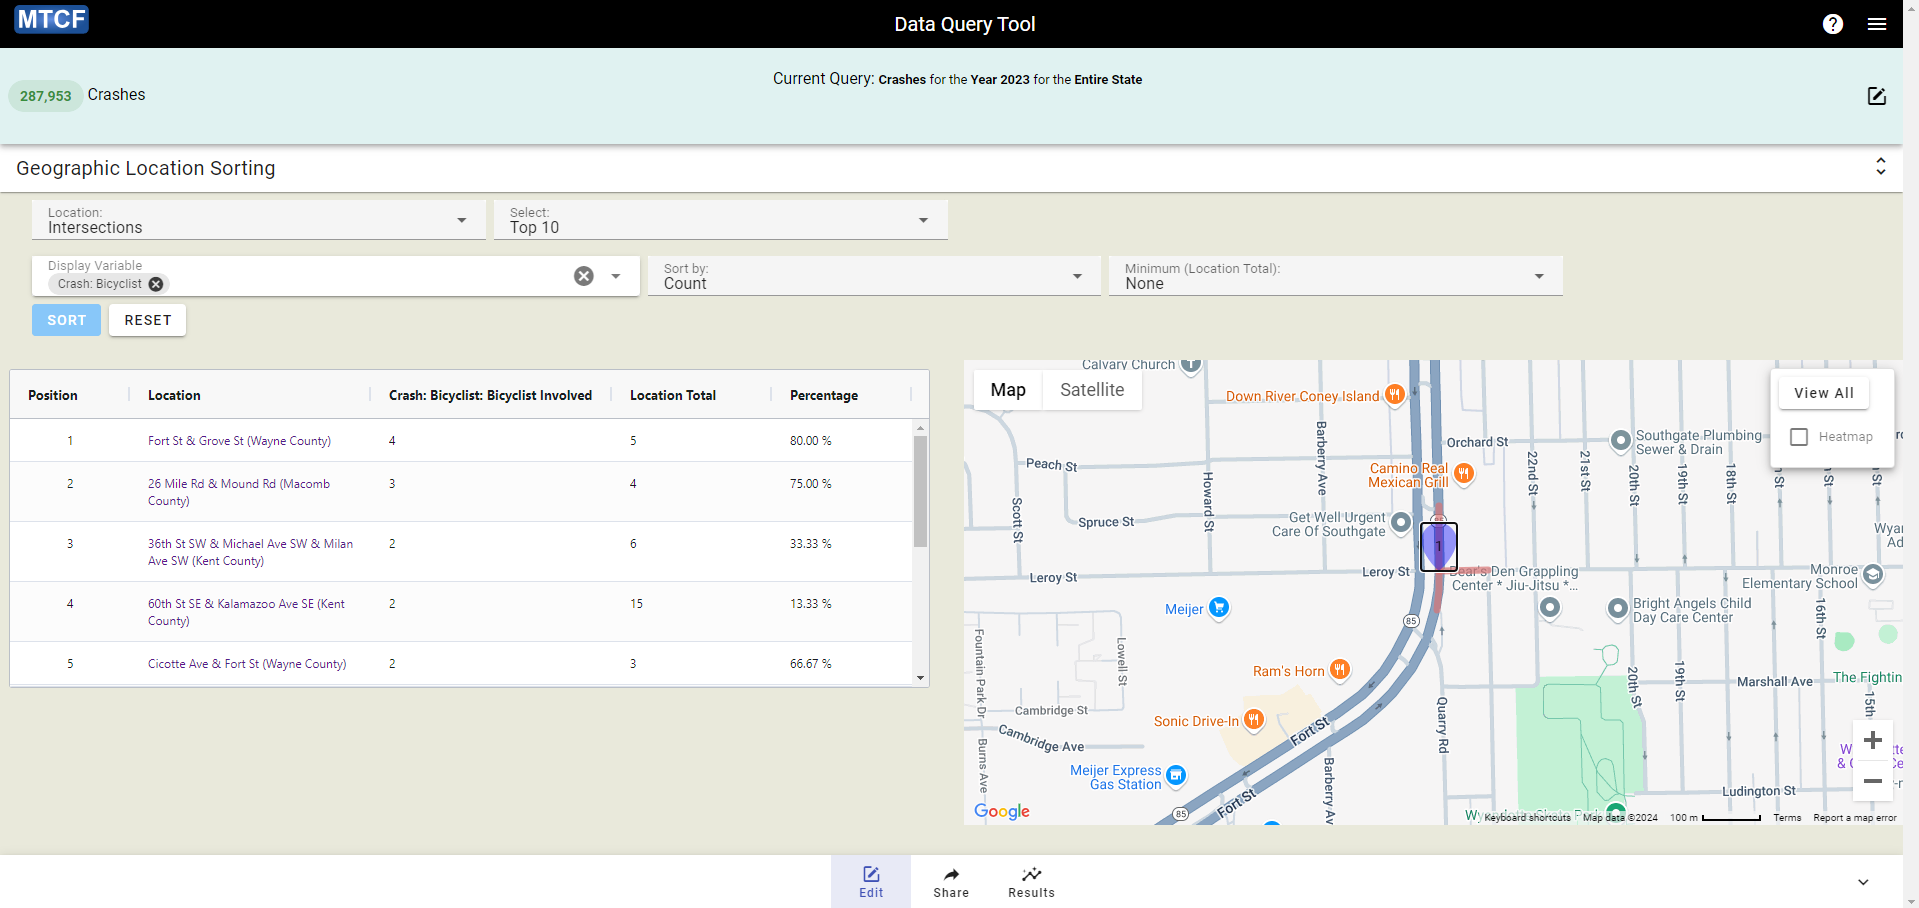
Once on the “Geographic Location Sorting” subpage, we select the location type “Intersections” in the “Location” dropdown and “Top 10” in the “Select” dropdown. Then a display variable of “Crash: Bicyclist” so that our results will be sorted by bicyclist-involved crashes rather than overall crashes. This makes our final request to show the top 10 intersections with the highest count of bicyclist-involved crashes in 2023. Clicking “Sort” then produces the results shown in the screenshot below. According to these results, there was one intersection in 2023 that had four bicyclist-involved crashes and another that had three.
We will focus on the highest ranked intersection “Fort St & Grove St (Wayne County)” for the rest of this example. The map on the right side of the sorting interface can be zoomed to view that intersection by clicking on the name in the sorting table:
Step 2: Setting Up Crash Query
For this step, we recommend opening a second tab so that the table of intersections remains accessible.
Navigate back to the starting Data Query Tool interface and select “Filters”. We want apply two filters (see Filter Tutorial):
- Crash: Bicyclist = “Bicyclist Involved”
- Crash: Intersection = “Intersection Crash”
These will ensure that we’re only identifying bicyclist-involved crashes at intersections.
If configured correctly, at this stage the data query tool will show “945 Crashes” and list the current query as: “Crashes for the Year 2023 for the Entire State filtered by Crash: Bicyclist (Bicyclist Involved) and Crash: Intersection (Intersection Crash)”
After applying those filters, select the “Geographic Location” and then the “Intersection” option. Clicking the “Select Intersection” button will transition to the next step.
Step 3: Selecting Intersection
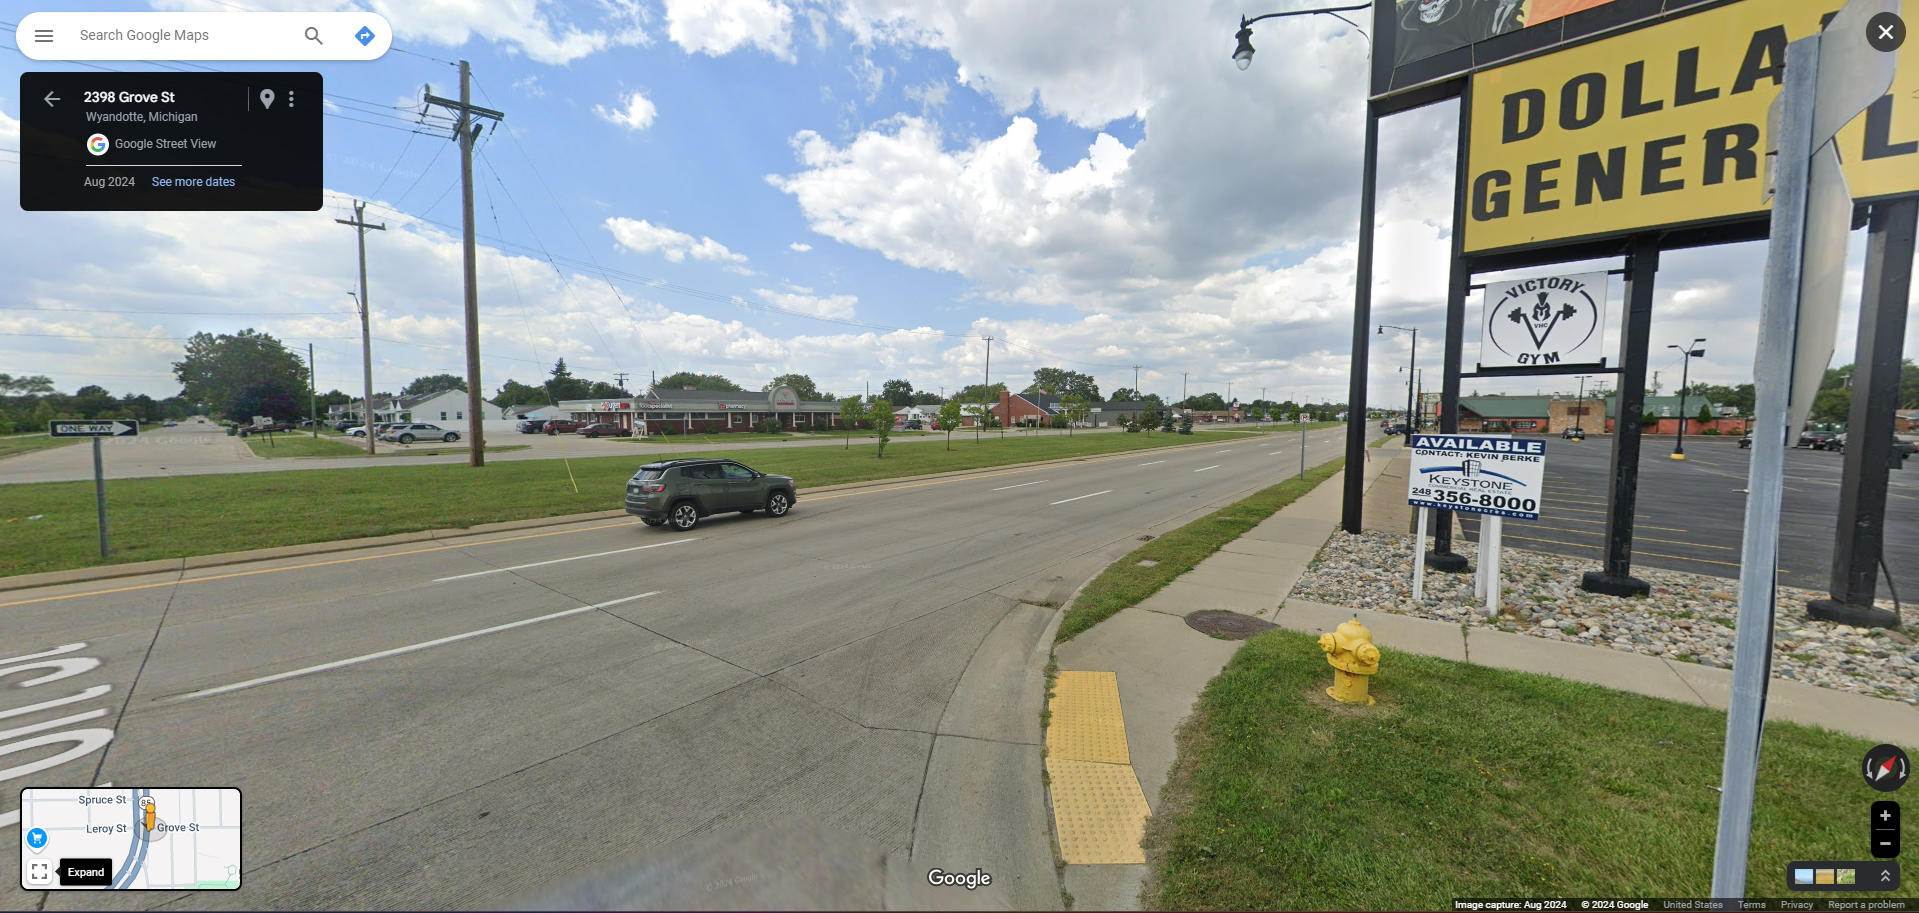
After clicking “Select Intersection” you will be redirected to a map of Michigan. From here, use this map to locate the “Fort St & Grove St (Wayne County)”. Once the map is zoomed in on a specific location, blue pins will appear identifying the available intersections. The map has a search box in the upper left that can automatically zoom to the correct location if you enter “Fort St & Grove St”.
Select the intersection of the correct roads and click it. This will trigger a pop-up box that lists the name of the intersection. In our case, it will read “Fort St & Grove St” as shown below:
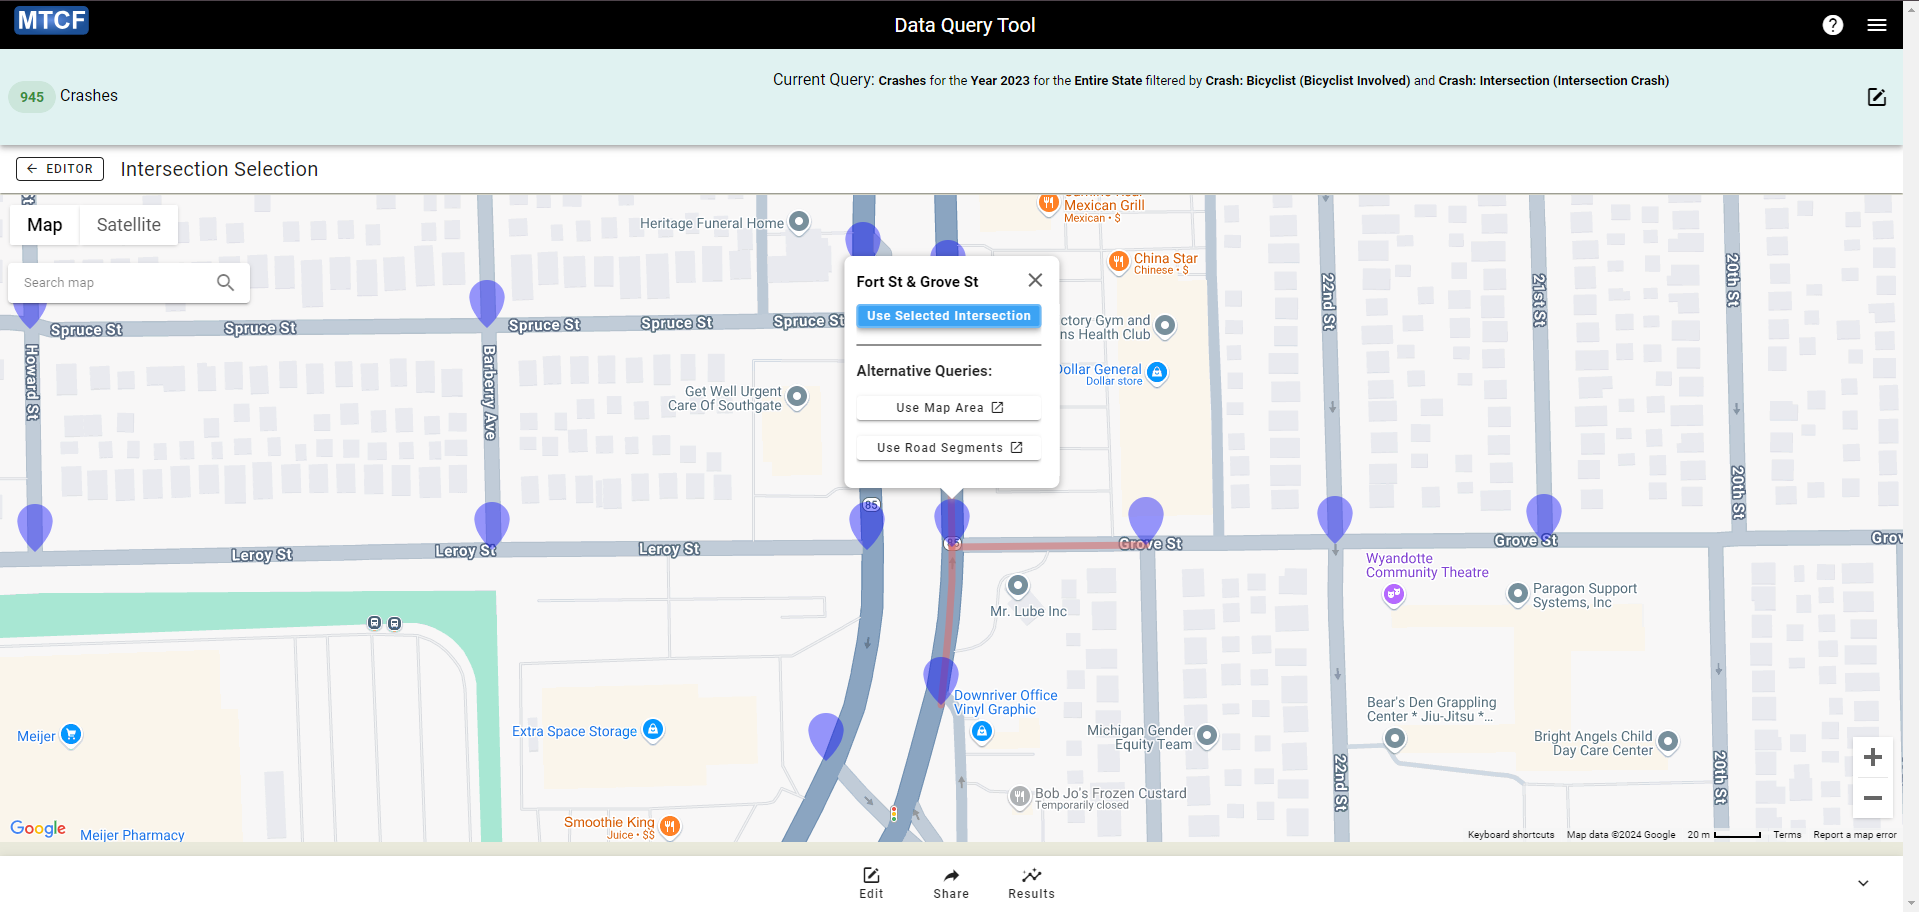
Once you have the correct intersection selected, click “Use Selected Intersection” in the pop-up box. (NOTE: if you forgot to set the “Intersection Crash” filter in Step 2, MTCF will automatically add that filter at this time.)
After clicking “Use Selected Intersection” the data query tool should show “4 Crashes” and a current query of: “Crashes for the Year 2023 at intersection of Fort St & Grove St in Wayne County filtered by Crash: Bicyclist (Bicyclist Involved) and Crash: Intersection (Intersection Crash)”. This matches our expected count of crashes at this location from Step 1.
Step 4: Examining Equity for Selected Crashes
After confirming the intersection, select the “Results” button in the control panel at the bottom of the screen and click on “Table” to move to the table creation interface. Once there, click on the “Select Row(s)” dropdown menu and then select “Equity: Diesel Particulate Matter EJI (2022+)” and click “Apply” to create the table. (NOTE: in the dropdown menu, the equity measures will be at the bottom and colored yellow.)
The table will now show the level of concern suggested for the crashes at this intersection according to the EJI methodology. Note that it is possible for crashes at a particular intersection to have different levels of concern because different sides of the intersection may be in different Census tracts, but this is not the case at Fort St & Grove St, so our table will only have a single row.
The table for Fort St & Grove St is shown below:
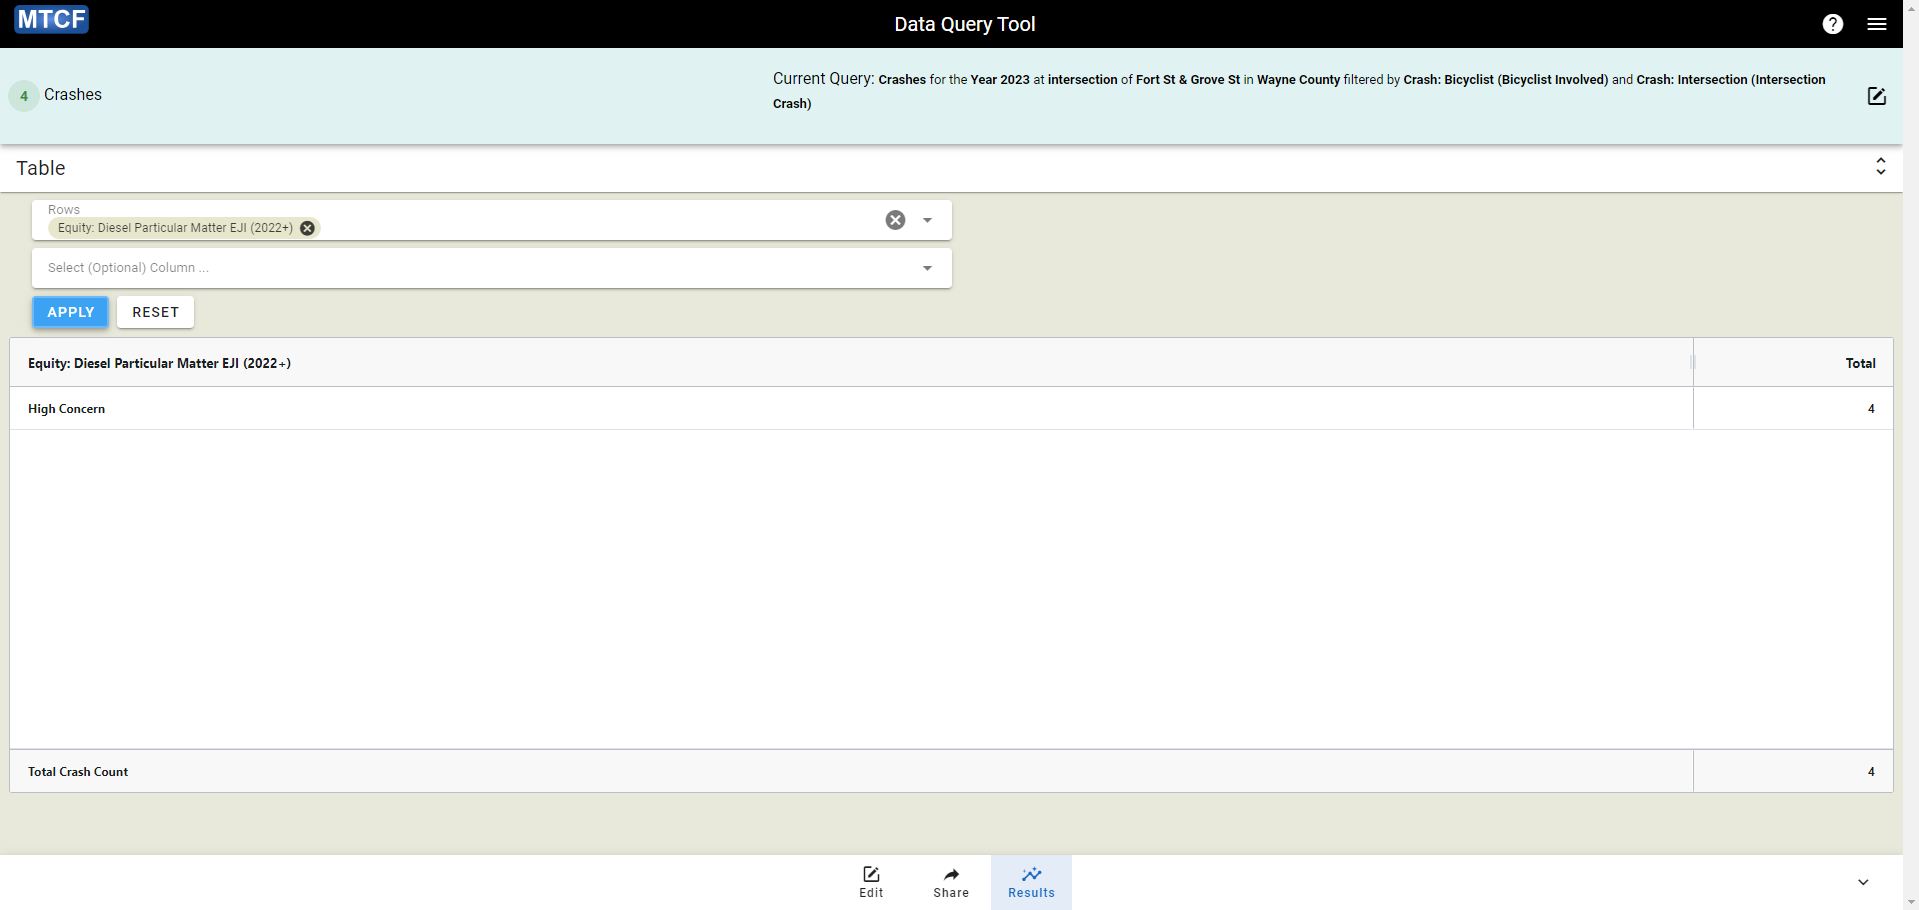
As you can see, according to the EJI methodology, the intersection at Fort St & Grove St does appear to have an inequitable level of diesel particulate matter. This may make sense as this seems to be an intersection connecting a residential road (Grove St) to a three-lane road through a commercial area (Fort St) and is located in a region (Detroit) that has a higher minority population than much of the state.
Step 5 (Optional): Repeat Steps 3 and 4 for other intersections
Interested users can repeat Steps 3 and 4 for other intersections identified in the original sorting, such as “26 Mile Rd & Mound Rd (Macomb County)” which had three bicyclist-involved crashes, to see if a similar pattern is present there.
2. Examine the distribution pedestrian-involved crashes in the City of Kalamazoo across regions based on their equity scores
Step 1: Setting Up Crash Query
Open a clean instance of the Data Query Tool interface and select a “Time Frame” of 2023. Then, under “Geographic Location”, click on “City or Township” and locate “Kalamazoo County: Kalamazoo” in the list of locations and select it.
Next we want one filter (see Filter Tutorial):
- Crash: Pedestrian = “Pedestrian Involved”
These will ensure that we’re only identifying pedestrian-involved crashes.
If configured correctly, at this stage the data query tool will show “40 Crashes” and list the current query as: “Crashes for the Year 2023 for City or Township (Kalamazoo County: Kalamazoo) filtered by Crash: Pedestrian (Pedestrian Involved)”
Step 2: Tabling
Click “View Table” to be directed to the tabling interface and then select “Equity: Diesel Particulate Matter EJI (2022+)” in the “Select Row(s)” dropdown menu. (NOTE: in the dropdown menu, the equity measures will be at the bottom and colored yellow.) After doing so, click “Apply” to generate the table shown below.
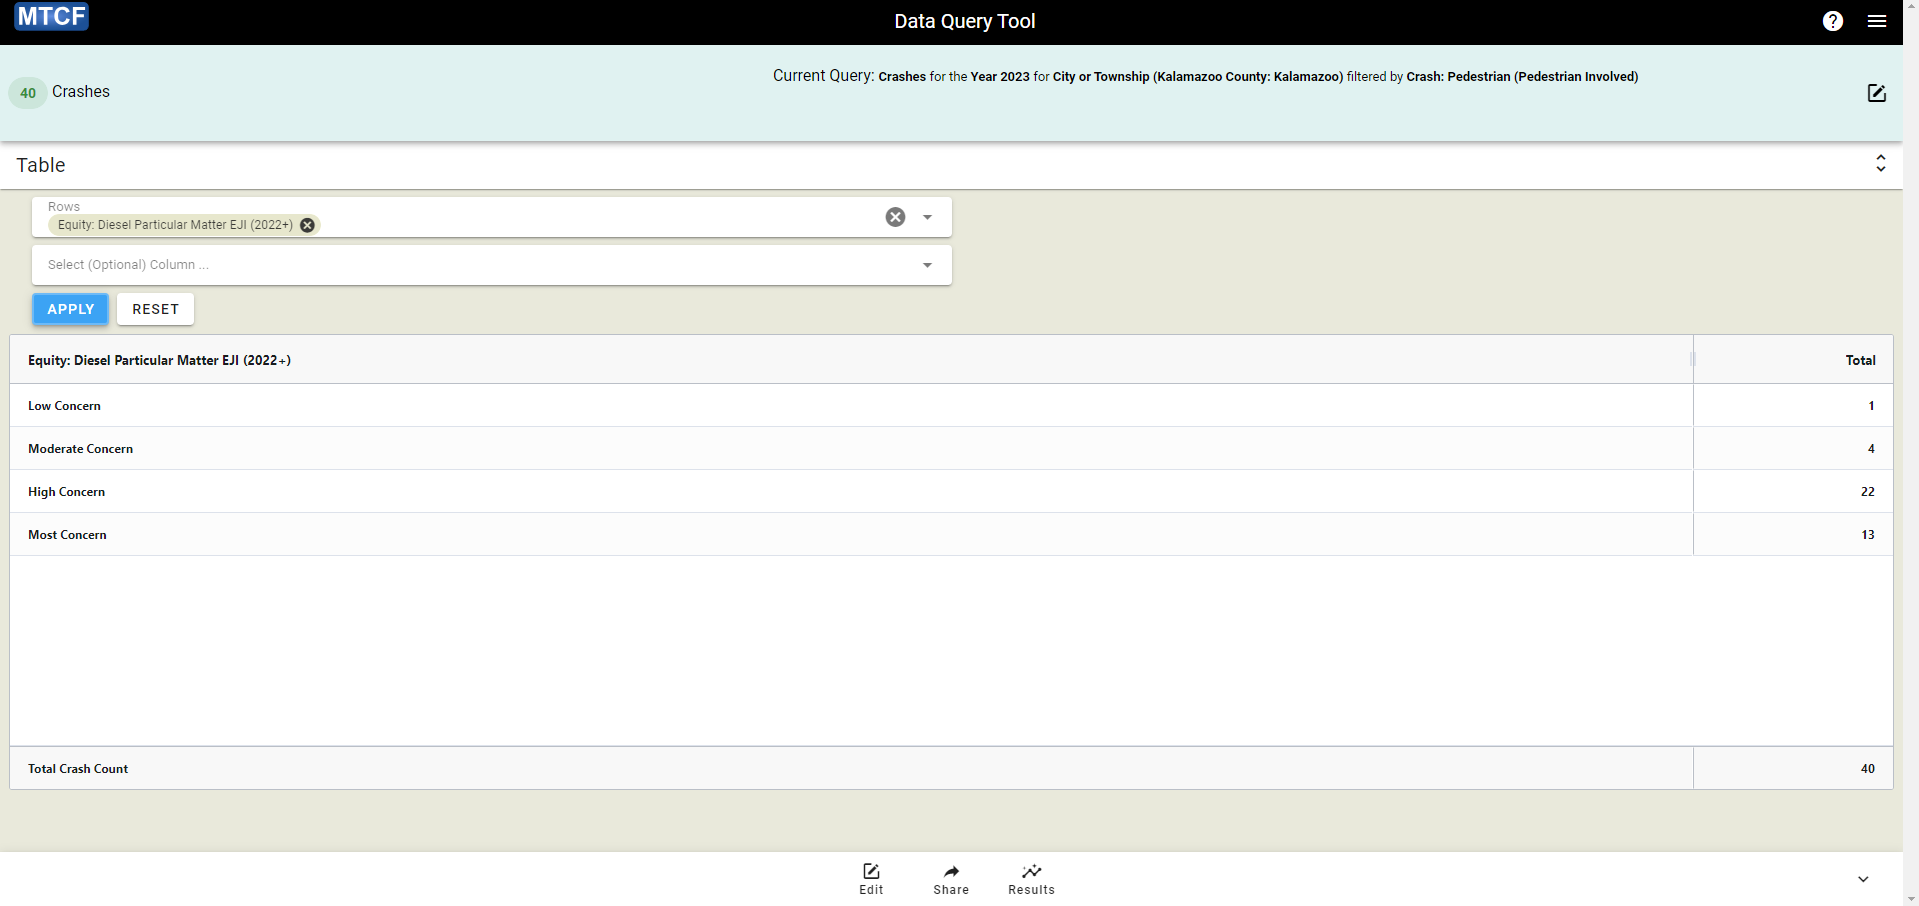
This table provides an overall summary of equity for bicyclist-involved crashes in Kalamazoo, which suggests that many crashes are located in regions with inequitable levels of diesel particulate matter. However, this does not include the geographic component, so it can be useful to look at these crashes on a map to evaluate that.
Step 3: Map Visualization
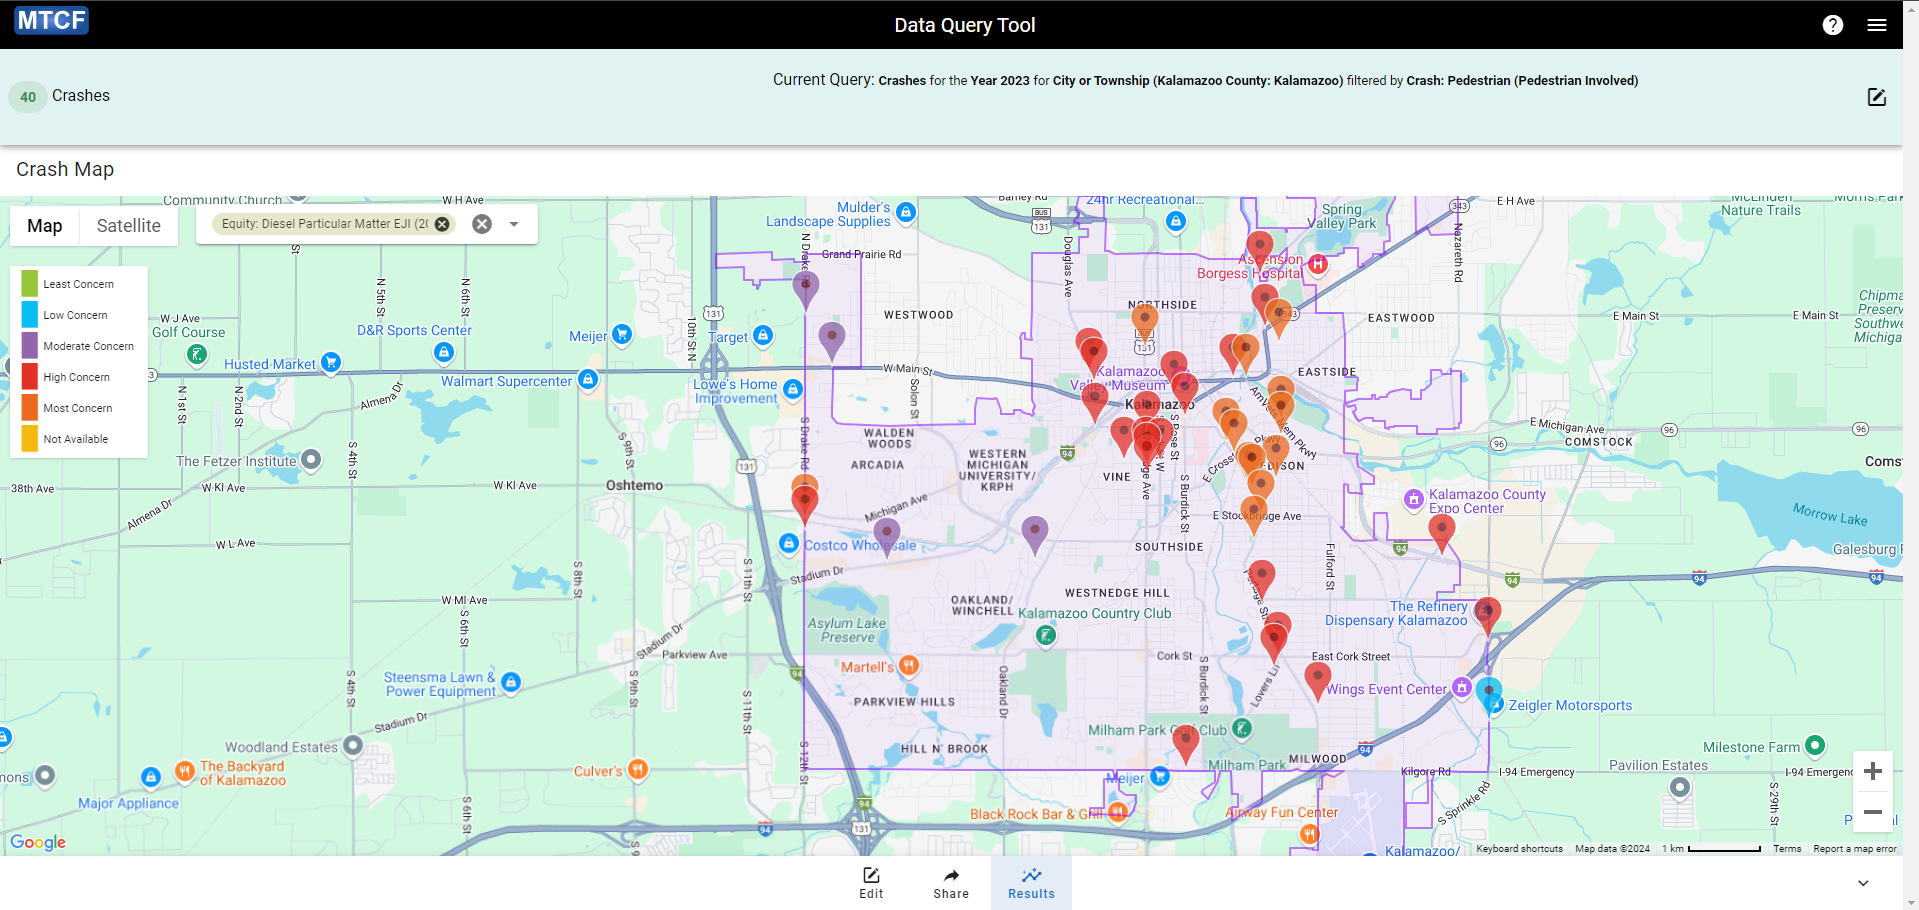
Select the “Results” button in the control panel at the bottom of the screen and click on “Crash Map” in the pop-up menu. This will redirect you to the map view which will show a map of Kalamazoo (with the city boundaries in purple) and the locations of the bicyclist-involved crashes (shown by the red pins).
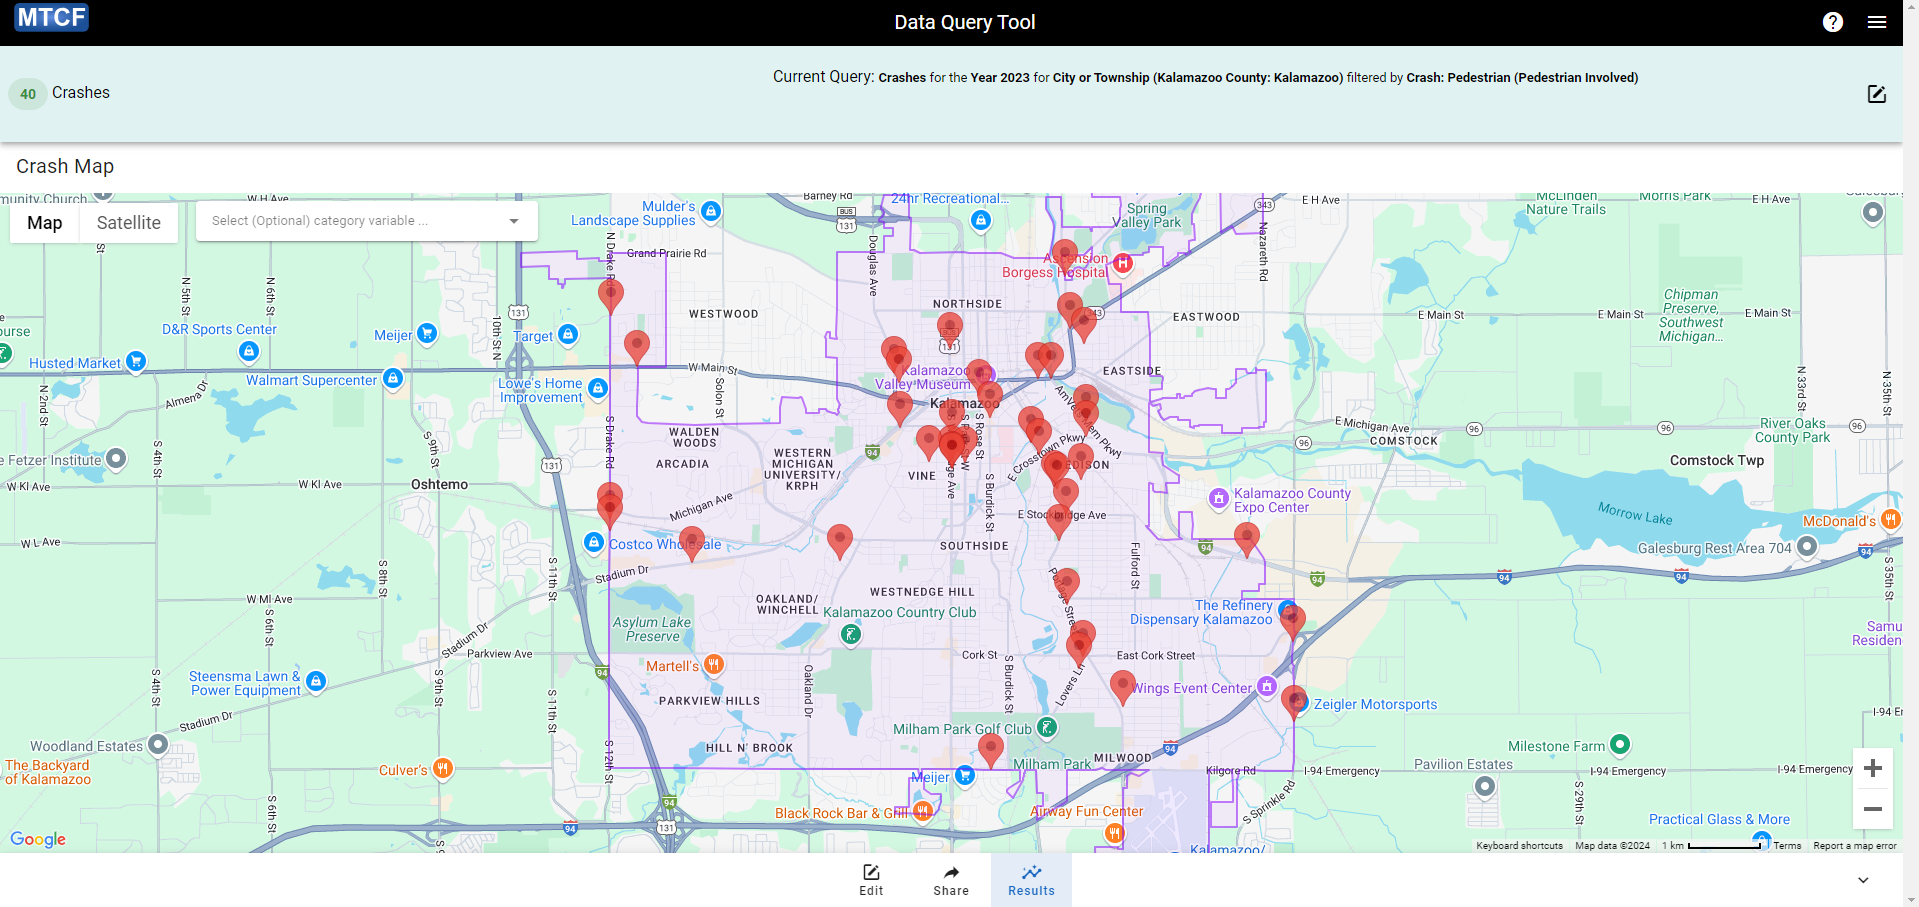
Select the “Select (Optional) category variable” dropdown menu on the top left of the map and choose “Equity: Diesel Particulate Matter EJI (2022+)” again. Each of the pins marking the crash is now colored according to its EJI value as shown by the legend on the left side of the map. Clicking on any of the pins will open a sidebar with details on that crash.