Using Community Resilience Index on MTCF
Community Resilience Index
The Community Resilience Index (CRI) is one of several scores that the Federal Emergency Management Agency (FEMA) uses as part of its National Risk Index. The CRI reflects the community’s ability to prepare for, adapt to, and recover from natural disasters and other types of disruption. It is inversely related to the community’s risk, so higher values indicate a more resilient (and less risky, less concern) community. The base data for the index was provided by the University of South Carolina Hazards and Vulnerability Research Institute which used data from the American Communities Survey. FEMA summarizes the raw CRI values into five categories using quintiles of the national scores.
MTCF users can access the national categorical value as well as a Michigan-focused value that uses the same five-level categorization but based on quintiles of the index within the state. While nominally available for Census tracts, the CRI relies on county-level data and does not vary for tracts within a county. As such, the CRI available on MTCF are tied to the county to avoid confusion. The CRI values available on MTCF were updated in March 2023.
The county-level CRI equity variables are available on MTCF: National Community Resilience and Michigan Community Resilience. More information on the derivation and use of the CRI can be found here: https://hazards.fema.gov/nri/community-resilience.
Example Use Cases
The primary advantages county-level equity measures have over tract-level measures are that they make it easier to visualize statewide trends and that there is more data available at the county level. For example, due to the higher density of Census tracts in urban areas and the sheer number of tracts in Michigan (more than 3,000 as of 2021) state-level visualizations of tract-level data can be difficult to parse and draw conclusions from visually.
In this section we will demonstrate how CHR&R can be used to answer questions about the equitability of crashes using the MTCF website. We will be addressing two research topics:
- Examine how rates of pedestrian-involved crashes correspond to the CHR&R areas of high concern
- Compare the distribution of crashes involving speeding to crashes overall across counties with different CHR&R scores
The presence of rates in the first topic requires that we use county-level equity measures because exposure metrics, like VMT or licensed drivers, will only be available for at the tract level. The second topic can also be addressed using tract-level metrics, but we choose to use a county-level metric for demonstration.
For these example use cases, we will be using the “Michigan Community Resilience” score (since it is best calibrated to show differences within the state).
1. Examine how rates of pedestrian-involved crashes correspond to the CRI areas of high concern
Step 1: Get Pedestrian-involved Crash Rates
From the MTCF Data Query Tool, click on “Time Frame” and select 2023. With 2023 selected, click on “View County Map” from the list of Output options on the right.
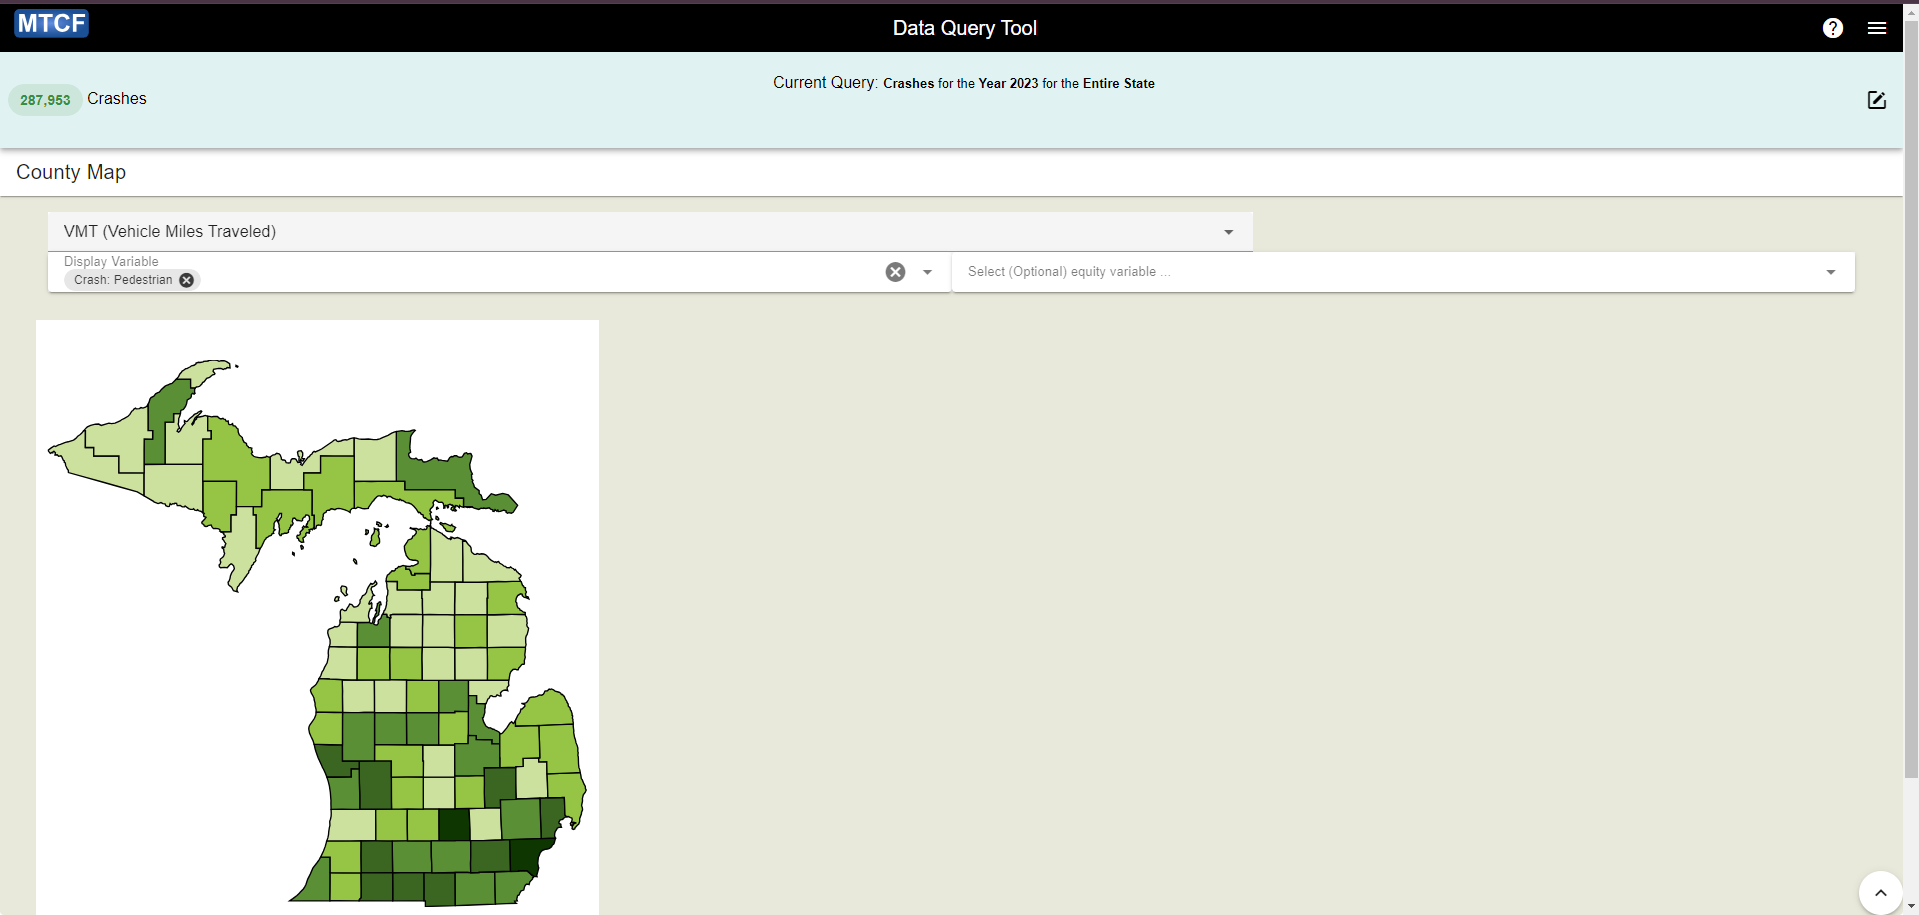
On the County Map page, use the dropdown menu for “Rate” to select “VMT (Vehicle Miles Traveled)” and the dropdown for “Select (Optional) display variable” to select “Crash: Pedestrian”. The map below will automatically update with each of these changes.
Once these options are selected, the map will show the counties colored according to their pedestrian-involved crash rates. Darker shades indicate higher rates and lighter shades indicate lower rates.
Note that Wayne, Ingham, Kent, St. Joseph, and Kalamazoo counties have the highest rates (in that order) and seven counties have pedestrian-involved crash rates of zero per million VMT, indicating 0 pedestrian-involved crashes in that county.
At the end of this step you should see the following:
Step 2: Add Equity Overlay
Now click on the “Select (optional) equity variable” dropdown and select “Equity: Michigan Community Resilience (2022+)”. This will add an additional interface that allows you to select which levels of concern should be marked for the selected equity measure.
Using that interface, select the “Most Concern” category (meaning the 20% most inequitable according to the Michigan Community Resilience Index). This places yellow circles on the counties that are of most concern.
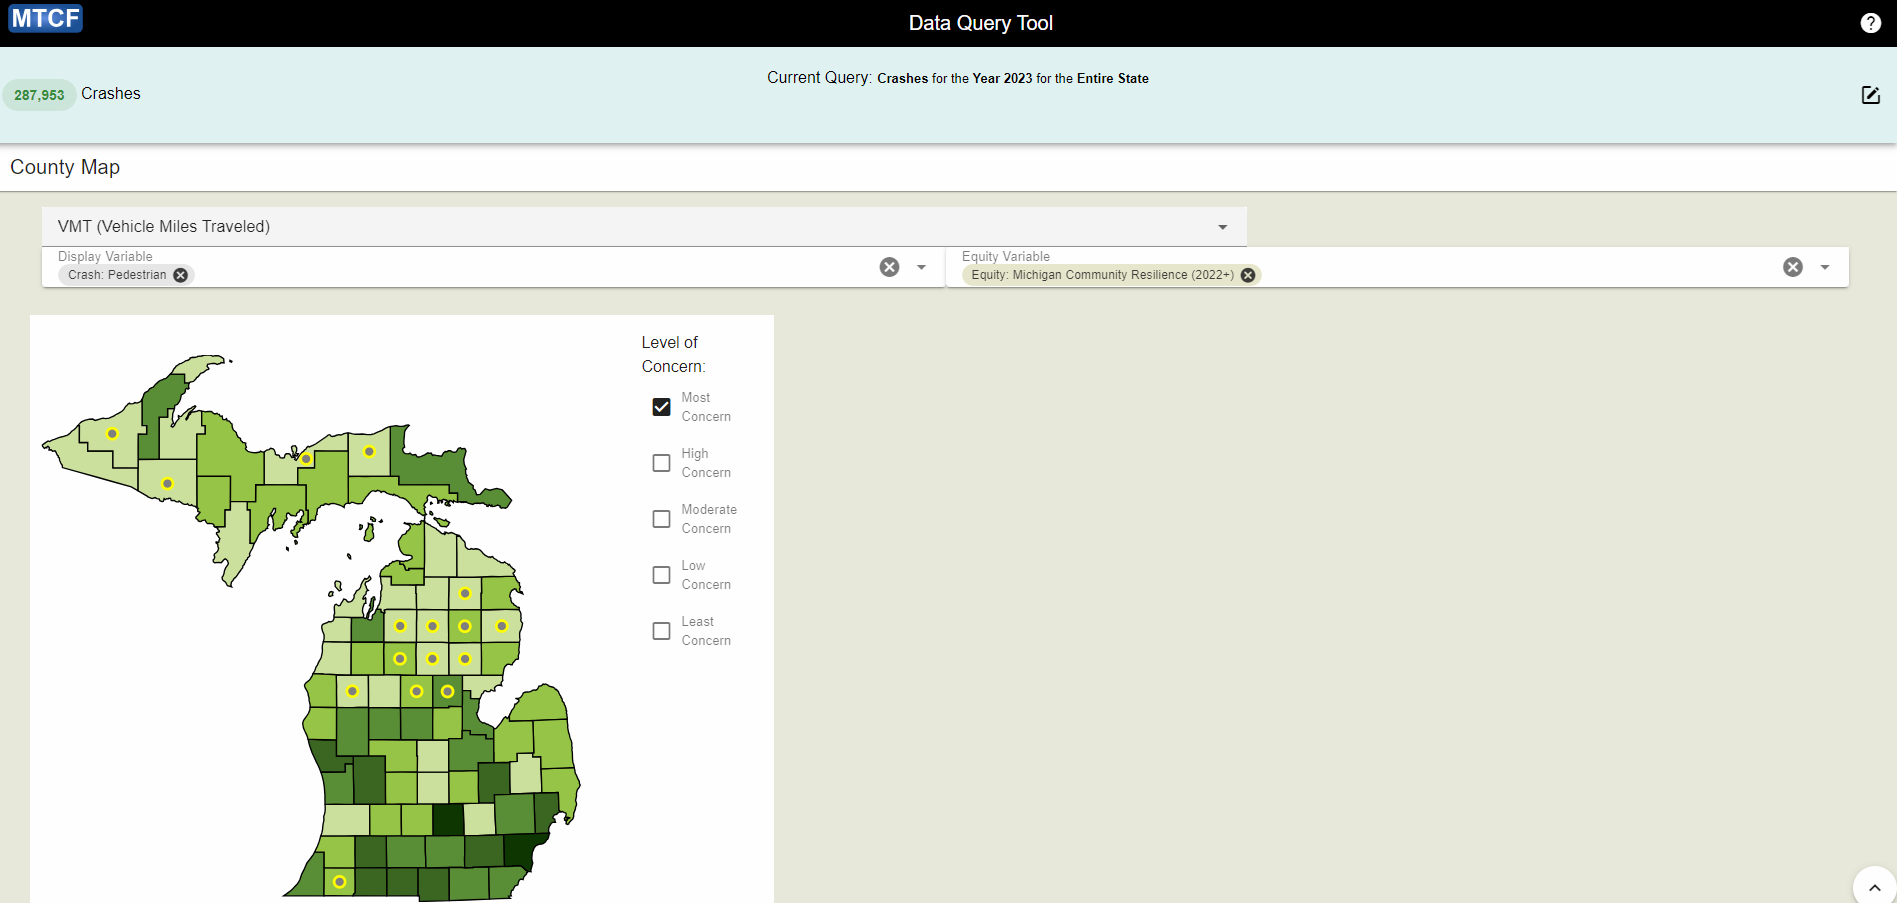
Note that there is very poor overlap between counties with high rates of pedestrian crashes and counties that are marked as “Most Concern” by the Michigan Community Resilience Index. This may be because many factors that reduce resilience (such as lack of public infrastructure) also reduce the prevalence of pedestrians.
If we increase the marking to include “High Concern” counties (as shown in the screenshot below) it does not meaningfully change this pattern, though it does capture Wayne county.

2. Compare the distribution of crashes involving speeding to crashes overall across counties with different Michigan CRI scores
Step 1: Establish Baseline
From the MTCF Data Query Tool, click on “Time Frame” and select 2023. With 2023 selected, click on “View Table”.
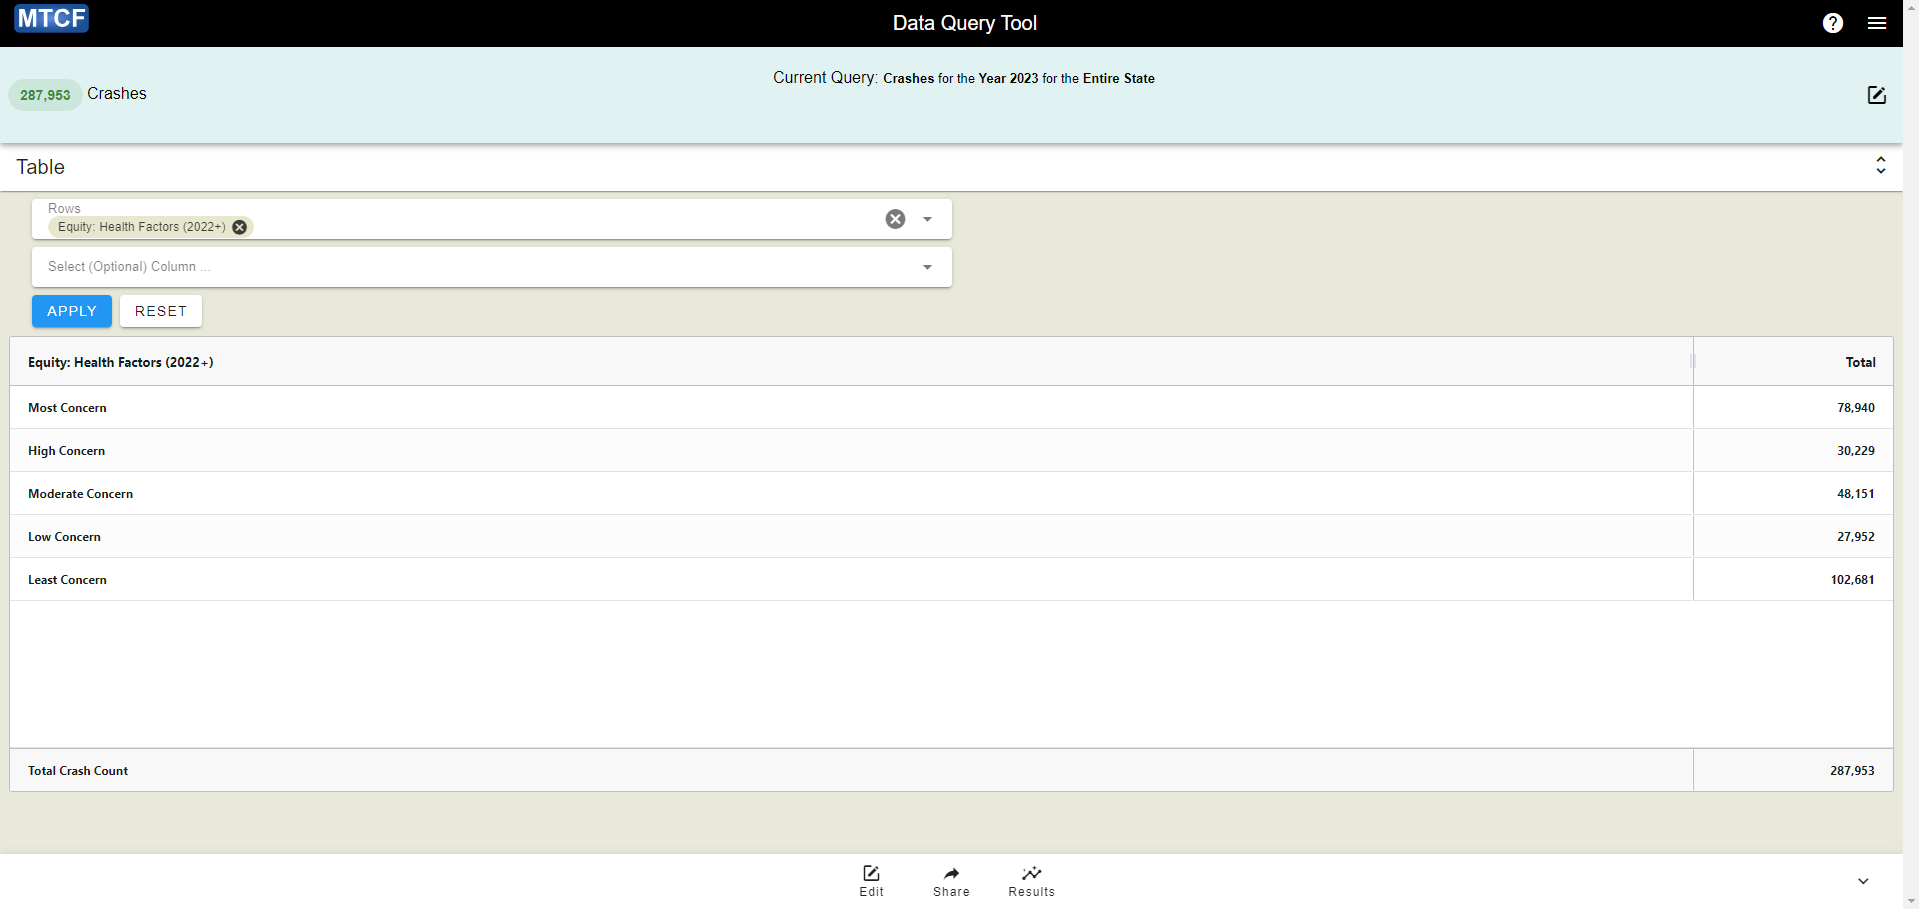
On the Table page, click on the dropdown menu for “Select Row Variable(s)” and select “Equity: Michigan Community Resilience (2022+)”. Then click “Apply”. This table is our baseline for the occurrence of crashes in counties in each equity category.
Step 2: Configure Speeding Crash Query
Open a new instance of the Data Query Tool (or select “Edit Query” from the end of the previous step if you have saved the output) and open the “Filters” selection.
In order to identify crashes involving speeding, we need to apply two filters:
- Hazardous Action = “Speed Too Fast”
- Traffic Unit Type = “Motor Vehicle”
Note that these are both unit-level filters (the blue section in the filter dropdown). As such, we will identify crashes that have one or more motor vehicles whose drivers were coded as “Speed Too Fast” by the responding police officer at the time of the crash.
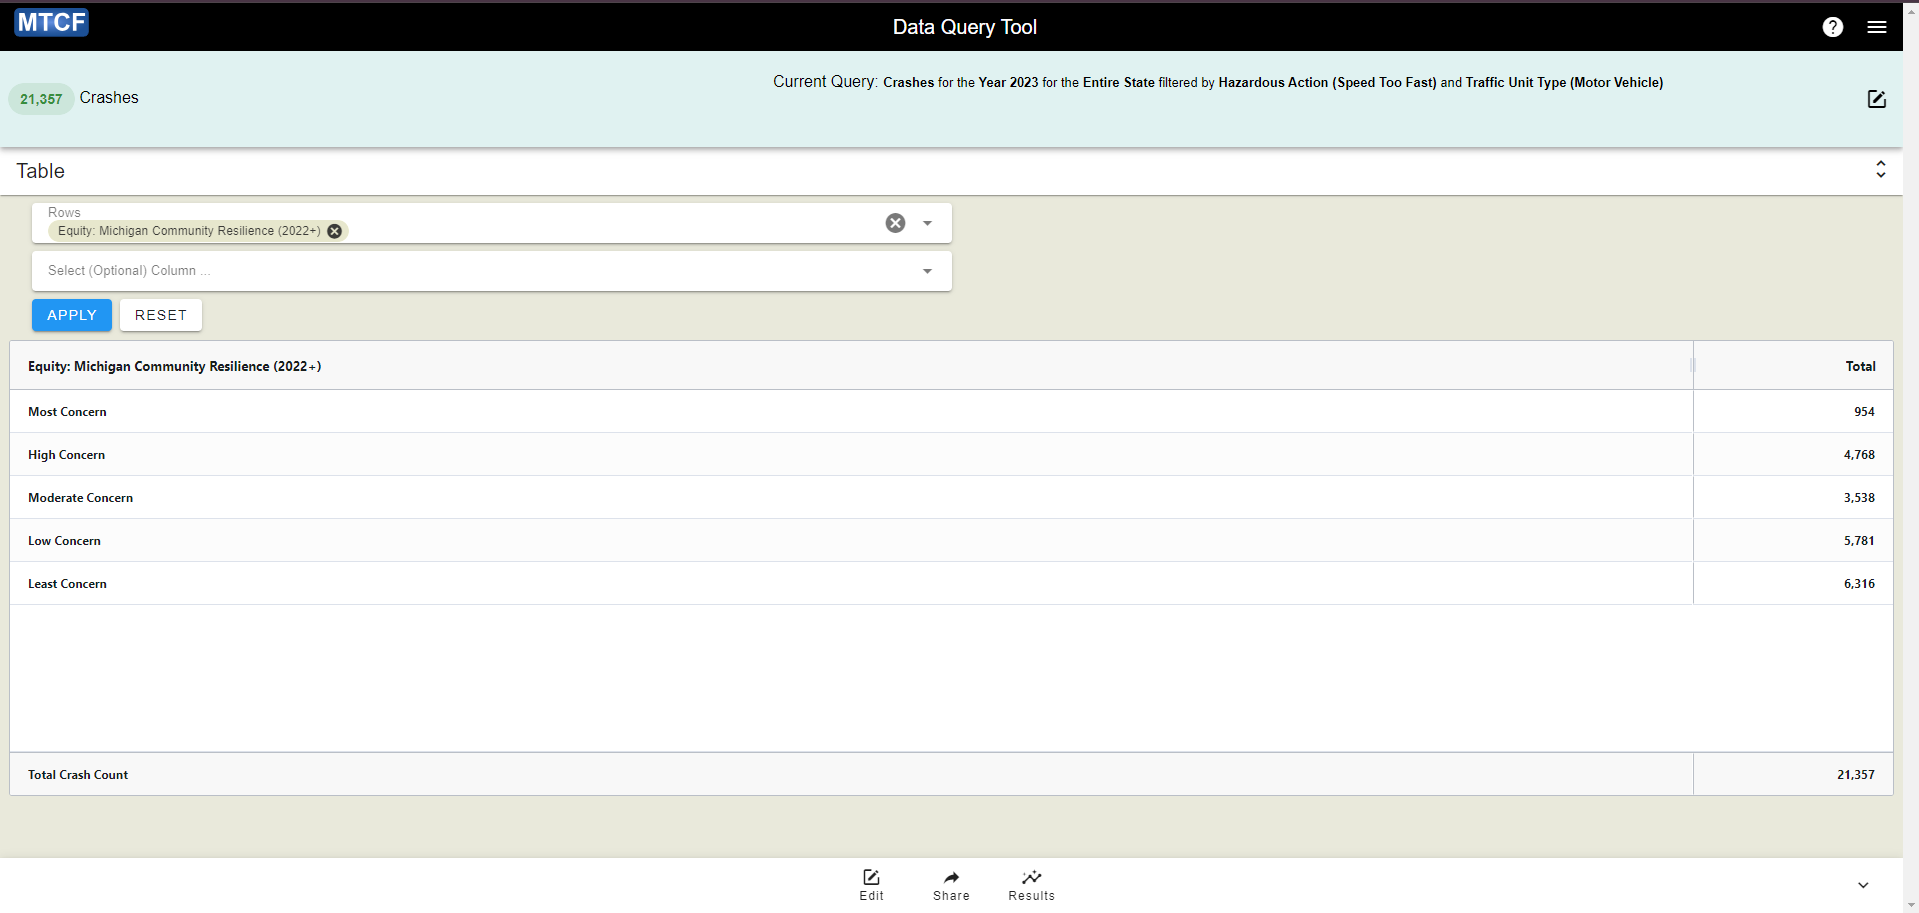
If these filters are correctly applied, the Data Query Tool will show “21,357 Crashes” and the current query will be: “Crashes for the Year 2023 for the Entire State filtered by Hazardous Action (Speed Too Fast) and Traffic Unit Type (Motor Vehicle)”.
Step 3: Create Speeding Table
After applying the filters in Step 2, create a table using the filtered dataset following as in Step 1. You may again wish to export the table to make calculating the percentages easier.
Step 4: Compare Behavior
Once you have both tables, you can compare the results as in the table below:
| Level of Concern | All Crashes | Crashes Involving Speeding |
|---|---|---|
| Most Concern | 27.4% | 4.5% |
| High Concern | 10.5% | 22.3% |
| Moderate Concern | 16.7% | 16.6% |
| Low Concern | 9.7% | 27.1% |
| Least Concern | 35.7% | 29.6% |
Based on these data, it appears that crashes involving speeding are substantially less common in areas of most concern (as defined by the Michigan Community Resilience Index) than crashes overall. This may suggest that the factors that influence community resilience are not well aligned with the factors that produce poor outcomes from speeding. Note that the speed limits in northern Michigan are higher than other parts of the state (e.g., 75 mph vs. 70 mph on I-75). It is also possible that high speeds are less likely to be coded as hazardous by police in these areas (e.g., on rural highways).