MTCF Equity Variables
Background
After a review of equity measures available for public use, a total of 18 equity variables were selected for inclusion on MTCF.
In order to display these equity variables in a useful way on MTCF, crashes were grouped in quintiles that will enable users to generate tables and compare patterns. Quintiles divide the equity variables into five equally sized bins based on the relevant geography (county or Census tract). To ensure consistency across the indices, the quintiles were labeled from “Least Concern” to “Most Concern.”
Each newly generated quintile variable based on either county or Census tract data is prefixed with the word “Equity” for clarity and ease of use. All 18 variables are available for use in generating charts or tables when viewing results. Although at the crash level, these variables are all shaded yellow to distinguish them from the current crash level (white), vehicle level (blue), person level (pink), and demographic (gray) variables.
County Health Rankings and Roadmaps
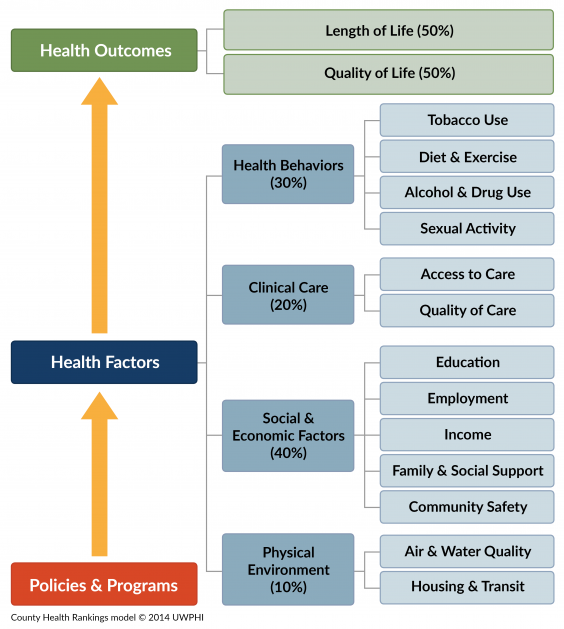
The County Health Rankings and Roadmaps (CHR&R) is a program run by the University of Wisconsin Population Health Institute. The program uses a large number of datasets from state and national sources that provide targeted measures of health. Those measures are then combined within categories as shown in the figure below (source: CHR&R Methods Website).
MTCF users can access the 2022 scores for the top-level measures of health (Health Outcomes and Health Factors) and their immediate sub-categories (shown in the figure below – two making up Health Outcomes and four making up Heath Factors). Each county is assigned a rank from 1 to 83, with 1 indicating the highest ranking (least concern) and 83 the lowest (most concern). Users can also access a simplified score that groups counties into five groups (ranks 1-17, 18-33, 34-50, 50-66, and 67-83).
The county-level CHR&R equity variables are available on MTCF: Health Outcomes, Health Factors, Length of Life, Quality of Life, Health Behaviors, Clinical Care, Social and Economic Factors, and Physical Environment. More information on the CHR&R, and details on the sources it draws from, can be found on the organization’s website: https://www.countyhealthrankings.org.
Community Resilience Index
The Community Resilience Index (CRI) is one of several scores that the Federal Emergency Management Agency (FEMA) uses as part of its National Risk Index. The CRI reflects the community’s ability to prepare for, adapt to, and recover from natural disasters and other types of disruption. It is inversely related to the community’s risk, so higher values indicate a more resilient (and less risky, less concern) community. The base data for the index was provided by the University of South Carolina Hazards and Vulnerability Research Institute which used data from the American Communities Survey. FEMA summarizes the raw CRI values into five categories using quintiles of the national scores.
MTCF users can access the national categorical value as well as a Michigan-focused value that uses the same five-level categorization but based on quintiles of the index within the state. While nominally available for Census tracts, the CRI relies on county-level data and does not vary for tracts within a county. As such, the CRI available on MTCF are tied to the county to avoid confusion. The CRI values available on MTCF were updated in March 2023.
The county-level CRI equity variables are available on MTCF: National Community Resilience and Michigan Community Resilience. More information on the derivation and use of the CRI can be found here: https://hazards.fema.gov/nri/community-resilience.
Environmental Justice Screening and Mapping Tool
The Environmental Protection Agency (EPA) maintains the Environmental Justice Screening and Mapping Tool (EJScreen) as a means to evaluate inequalities in exposure to various forms of environmental burdens. For EJScreen, the EPA monitors 13 environmental indicators describing exposure to various types of pollution, emissions, or risk factors. These indicators are then combined with a demographic index that reflects the presence of low-income people and people of color in the area. This produces an Environmental Justice Index (EJ Index) where higher values indicate high prevalence of the environmental risk co-occurring with marginalized populations. EJScreen provides each of the EJ Indices as a percentile (nationally and within each state) as an easy way to identify where the environmental justice concerns are most prevalent.
Since MTCF is focused on crash outcomes, users can access two traffic-relevant EJ Indices: diesel particulate matter and proximity to traffic. Both EJ Indices are available for Michigan Census tracts as percentiles, with 0 meaning least environmental justice concern and 100 indicating the most concern, and as a five-level categorical value based on the quintiles of index. The EJ Indices accessible on MTCF are taken from the 2022 EJScreen.
The tract-level EJScreen equity variables are available on MTCF: Diesel Particulate Matter EJI and Traffic Proximity EJI. More information on EJScreen, the datasets used, and interpretation of the indices is available from the EPA here: https://www.epa.gov/ejscreen.
Social Vulnerability Index
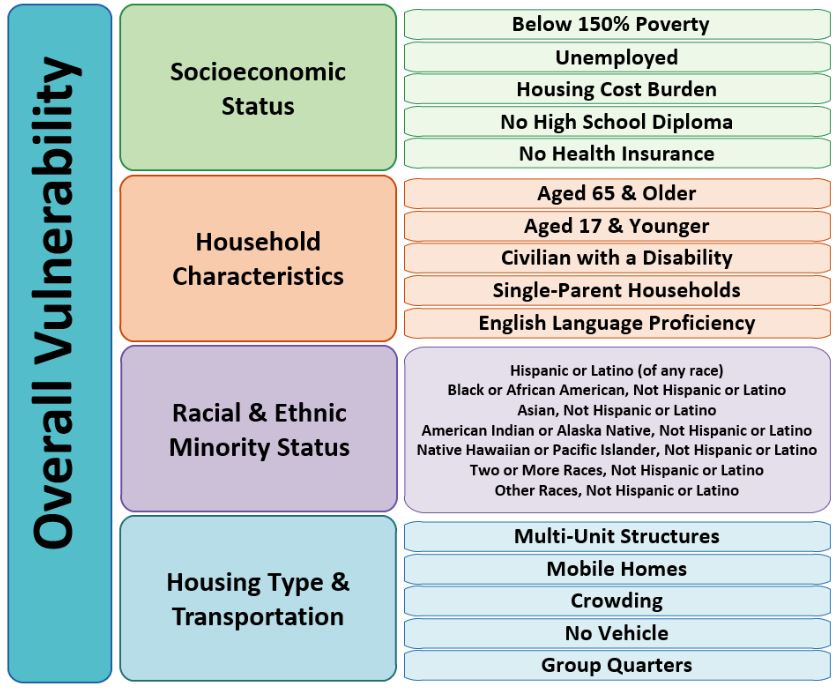
The Social Vulnerability Index (SVI) is a measure of how susceptible a community is to the stresses caused by disasters and/or disease outbreaks. The index is calculated by the Centers for Disease Control and Agency for Toxic Substances and Disease Registry (CDC/ATSDR) and uses 16 data elements from the U.S. Census Bureau to identify communities that may need additional support. In addition to the overall SVI value, the CDC/ATSDR provide four sub-scores that are calculated from various subsets of the Census elements as shown in the figure below. The SVI and all sub-scores are provided as both raw numeric scores and percentiles. High values for the SVI (or sub-scores) indicate that the community is more vulnerable to disruption from disasters.
MTCF users can query the overall SVI and all four of the sub-scores as percentiles and simplified five-level categorical values. The percentile values used are calculated for Census tracts within the state of Michigan with a value of 0 indicating the least concern for vulnerability and 100 indicating the most concern. MTCF uses the 2020 SVI (the most recent available at the time of this work).
The tract-level SVI equity variables are available on MTCF: Socioeconomic Status, Household Characteristics, Racial/Ethnic Minority Status, Housing Type & Transportation, and Social Vulnerability Index. More information on the SVI is available from the CDC/ATSDR here: https://www.atsdr.cdc.gov/placeandhealth/svi/index.html.
Community Resilience Estimates
The Community Resilience Estimates (CRE) dataset is compiled by the U.S. Census Bureau to evaluate the resilience of communities throughout the country. The CRE extracts ten risk factors from the American Community Survey (ACS) covering topics like low-income population, single/no caregiver households, health insurance coverage, and access to vehicles. The data are then summarized by recording the percent of the population in each Census geography with 0, 1-2, or 3+ risk factors termed low, medium, and high risk, respectively.
On MTCF users can access the percent of the population with 3+ risk factors (i.e., high risk) by Census tract for the state of Michigan, with 0 indicating communities of least concern and 100 indicating communities of most concern. As with other equity variables, a five-level categorical version of the variable is provided for tabling purposes with the levels being defined by quintiles of the observed data. The CRE values on MTCF are derived from the 2021 ACS.
The tract-level CRE equity variable is available on MTCF: Population with 3+ Risk Factors. More information on the CRE data can be found on the Census website: https://www.census.gov/programs-surveys/community-resilience-estimates.html.